Skip to content

Sahara is the all-in-one system for reservoir visualization, analysis, and monitoring.

Sahara is a reservoir visualization, analysis, and monitoring system.

Sahara enables optimized decision-making in reservoir management and production. With more than 40 specialized tools, it simplifies daily tasks, allowing more time for data analysis.

Present in multiple countries, we are trusted by numerous companies to support their operations.

Centralized and Interactive Data Management

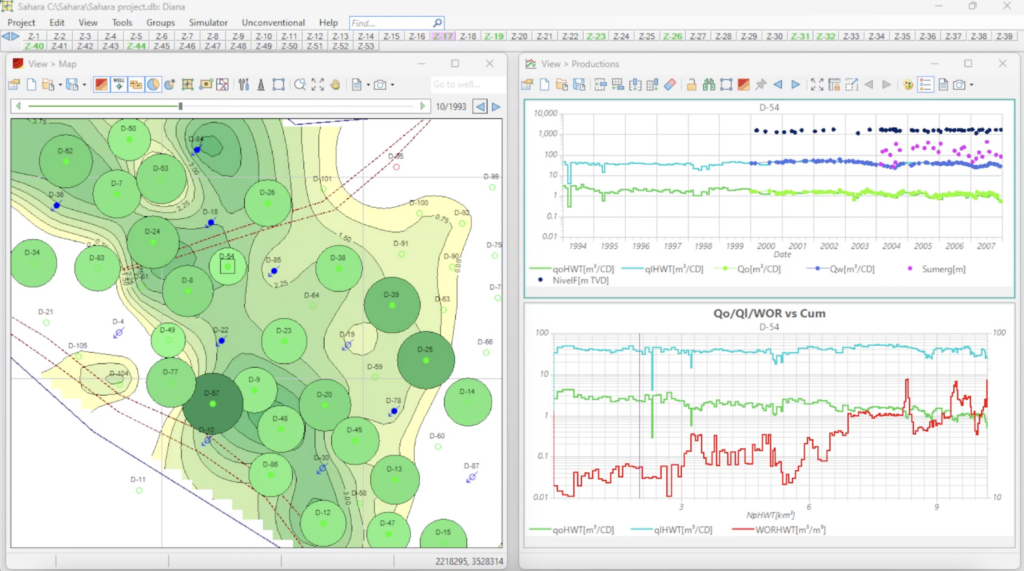
Sahara centralizes all the information needed for reservoir management and production within a single project. This ensures that data is organized in a structured way, making it easier to access and perform comprehensive analyses without relying on multiple sources.
Additionally, Sahara features interactive windows that provide integrated access to information, offering a dynamic and intuitive workflow. A wide range of charts offers multiple visualization options, allowing users to choose the best way to represent their data or combine different views to extract more detailed insights from a single analysis.
1

Advanced Diagnostic Tools

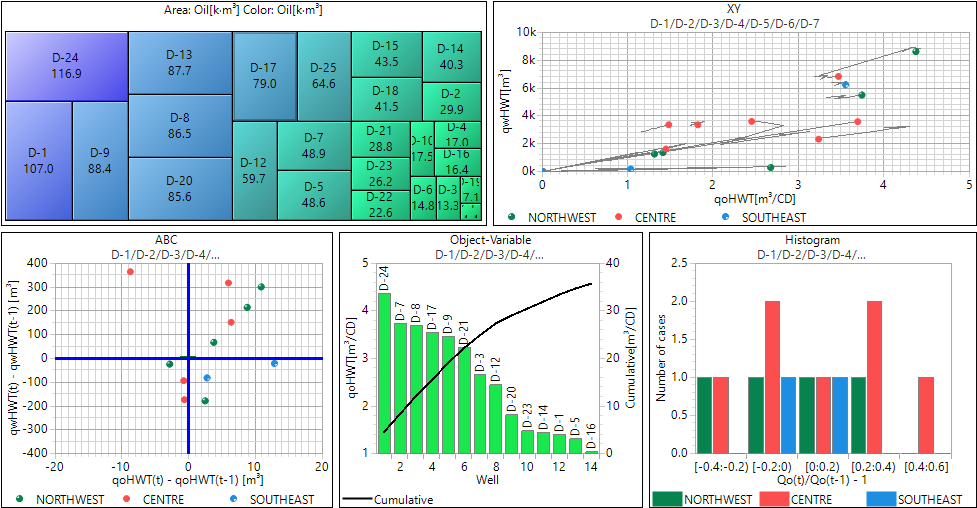
From basic field information, such as wells, profiles, production data, petrophysical data, and interventions, to production forecasting and specialized analyses, Sahara provides a complete environment. Its ability to integrate all this data into a single platform enables accurate diagnostics and helps optimize production efficiently.
Additionally, with its calculation tools, users can quickly obtain key results for reservoir monitoring and analysis, streamlining decision-making and improving operational efficiency.
1

Specialized Solutions for Unconventional Reservoirs

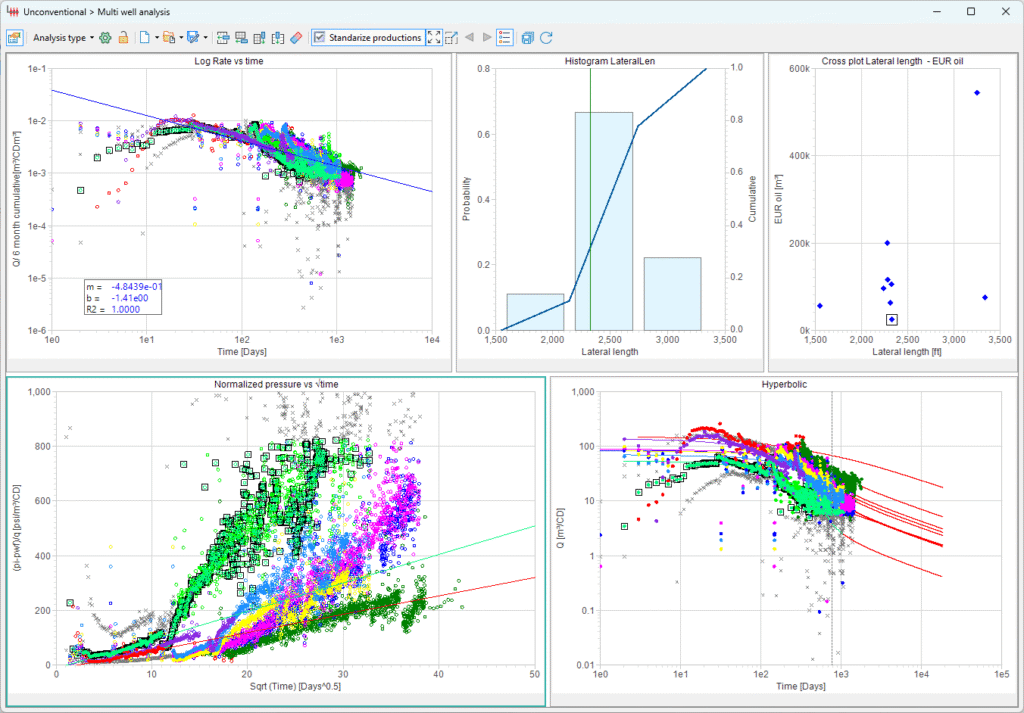
Sahara incorporates advanced tools for unconventional reservoirs.
In line with our innovation strategy, we have developed specialized features for the historical analysis of individual wells and well groups, providing key insights to optimize decision-making and improve field performance.
1

Conectivity

Sahara offers great flexibility in data import, allowing users to import and export data directly in all standard E&P application formats.


Data imported into the project can come from spreadsheets (Excel), tables (Access), or standard format files, as well as text files.
Sahara can access information stored in commercial database systems through a configuration tool that allows users to link project variables with fields in corresponding tables or views.
The system enables automatic template import with user-defined frequency and data range.

Map window

It could be considered one of the main windows in a Sahara project. Wells are displayed across the project area, positioned according to their location. By using attribute values, they can be identified with different symbols and colors.


Maps and lines of multiple variables can be displayed (either imported from other applications or generated within Sahara).
All project variables can be visualized as bubble maps per well or layer. Multiple variables and operations between them are also supported.
Users can select a variable to be plotted in the flow elements, such as oil saturation or cumulative production.
For the selected layer, it is possible to visualize the portion of the log in each well, based on the configuration set in the template.
Information related to injected tracers can be displayed, along with additional data on tracers recovered in nearby wells, such as arrival times and recovery percentages.
Visualization of parent-child interaction.

Wells information

Sahara provides visualization of various types of information stored in a project through dedicated windows, ensuring organized and comprehensive access to all data.


Production charts offer multiple configuration options. Data can be displayed for individual wells or groups of wells using different formats such as sum, overlay, stacked, or average.
Well log data can be displayed in templates with multiple user-customized tracks.
The wellworks window displays well logs, wellworks over time, open layers, and operations such as perforations, cementing, and tests.
By defining a trajectory on the map with the mouse, the user can generate a cross-section. Using available tools, layers can be correlated with log and tests data as a guide.
Log and wellworks can be visualized along the trajectory of a deviated well, allowing users to distinguish the layers it traverses.
3D graphics provide visualization of well trajectories, maps, and layer correlations between different wells.

Wells management

Sahara offers, within the Groups menu, the ability to filter, select and group wells using various tools, making it easier to review and analyze information.


This window is accessible from multiple tools, allowing users to select objects to work with. It displays the project’s object list, filtered by different criteria such as static and dynamic attributes, groups, equations, dates, and logs.
This window enables the visualization of object lists filtered according to the selected static attributes.
This tool allows the creation of all possible groups within a specific group category, based on predefined static attribute criteria.

Diagnosis and Monitoring

Sahara provides a variety of diagnostic tools for managing oil and gas production fields.


Allows users to visualize a large amount of information in various types of graphs and tables in an organized and functional way. The graphs, which offer flexible configuration options, interact with each other and with other windows within Sahara.
Enables quick comparisons of production variables using different analysis frequencies or scenarios. The comparison can be made with monthly production variables, daily production, or control data.
Allows the evaluation of recovery factors, with the additional objective of validating production distribution by layer and maps of pore volume and original oil in place. For secondary recovery projects, analysis related to injected volumes are also available.
This module allows users to enter and track actions related to different wells, identifying diagnostics, production losses, and other key aspects. It is possible to define responsible parties and review dates. This module is linked to the Map window, enabling analysis of the status of different wells within a field.
This module allows users to log and visualize well downtimes along with their associated production losses.

Declines

Through the analysis of decline curves at the well or group level, historical adjustments and forecasts can be made.


This module presents all the classic options for adjusting production data and offers a wide range of forecasting options. Sahara automatically adjusts the data range, providing interactivity that is particularly useful for this type of analysis.
It is possible to perform a bulk update of forecast declines using real-time updated data, avoiding the need to update well by well.
By normalizing the historical production of well groups to time zero, it is possible to generate type well rates for later use in forecast generation.
This feature allows the visualization and planning of production forecasts for different drilling and/or workover schedule scenarios. These alternatives are grouped into exercises, which contain type wells associated with drilling and repairs.
Forecast alternatives can be created with different data domains to allow for comparison between them. Each scenario offers the option to differentiate data by production type or reserve category.

Petrophysical tools

Sahara provides all the necessary tools for performing classical log interpretations and petrophysical analysis.


Well logs can be displayed in templates with multiple user-customized tracks.
Synthetic logs can be created using the most studied correlations for each variable or a user-defined equation.
Petrophysical values can be calculated by referencing any log and applying equations and cutoff values.
Allows the calculation of average porosity, net thickness, saturation, and hydrocarbon pore volume for each combination of defined cutoff values, based on their limits and increments, for selected wells and layers.  
Plots can be generated using log data. For each plot, the log type for each axis can be selected, along with maximum and minimum cutoff values. Classic crossplots such as Neutron-Density, Sonic-Density, Picket, and Hingle can also be chosen. Additionally, points can be selected directly on the plot to highlight the corresponding zones in the Logs window.
Generates lines between fault grids and structural maps.
Uses structural maps and contact depths at the layer level to calculate contact levels per well.
Analyzes the distribution of variable data within a Sahara project.

Geology – General tools

Sahara has a wide range of tools for generating information that can be used for various analyses.


Attributes can be calculated based on different criteria, for example, wells located within a given polygon.
This tool allows generating well status (oil producer, gas producer, water injector, etc.) based on production data, as well as open or closed layer status from static or dynamic data.
Grids can be generated from well data points in each layer.
This tool can be used to calculate volumes and areas of maps in individual layers or groups of layers. The area for the calculation may be defined by polygons or by injection patterns.
This tool allows generating new maps based on predefined or user-defined equations, using an equation editor that enables operations between maps and layer variables.
This tool allows the editing of relative permeability values for given saturation levels, making them available for use in other tools within Sahara.  

Production and Wellworks – General tools

Sahara has a wide range of tools for generating information that can be used for various analyses.


Sahara allows calculating production factors and allocation using different alternatives. Allocation can be performed at multiple levels and using various calculation methods.
This tool calculates the production and injection associated with wells using the injection pattern system as connections.
This tool evaluates locations by displaying information related to the layers they intersect and the data from neighboring wells.
Allows designing well trajectories within Sahara by inserting points or clicking on the structural map in the Map Window.
This tool is used to shift monthly production data by a specific number of months from a given date.
Based on monthly production data, it is possible to calculate representative values for each well, such as average flow rates, total accumulations, or accumulations for the first N months of production.
Allows performing various operations based on wellworks data, such as counting perforations per layer, calculating perforated thickness, tested thickness, or deriving test results as dynamic attributes.
This application enables the calculation of daily and monthly production based on control data and well shutdowns.

Statistical tools

Sahara offers a wide range of continuous and discrete probability distributions. These can be used to perform statistical analysis on the values of multiple variables and define hypotheses for a Monte Carlo simulation.


Allows users to plot the distribution of a particular variable’s data and compare it with the available theoretical distributions. For the best-fitting distribution, characteristic parameters can be obtained for later reference or used as hypotheses in a Monte Carlo simulation.
A Monte Carlo simulation can be performed to introduce the necessary level of uncertainty, providing a stochastic approach to the problem being analyzed.
An additional feature of the statistical analysis window is that it can be accessed from other Sahara tools, allowing analysis for different types of information: Maps, Logs, Crossplots, XY Graphs, and Unconventional Well Group Analysis.

Waterflooding simulator

Sahara features a multilayer injection pattern simulator, allowing well-by-well history matching of production data and generating forecasts using analytical models based on an interconnection pattern system between producer and injector wells.


Injection patterns can be independently designed for each layer and adjusted over time to reflect the actual field development history. This enables a highly detailed description of historical operating conditions, including well conversions and workovers.
Multiple injection alternatives can be created, allowing rapid sensitivity analysis of different injection configurations to optimize recovery.
Segregated Flow | Buckley-Leverett | Craig-Geffen-Morse | Characteristic Curve | WOR-Np Method
Simulation results can be analyzed over time through production graphs or as maps displaying pattern-related properties, such as saturation, injected pore volumes, and recovery factors.
Sahara’s simulator allows sensitivity analysis using the Monte Carlo method on the variables involved in the calculation, depending on the selected model.

VLP

Sahara provides the capability to calculate pressure losses for different wells in the project using correlations, allowing the assignment of various curves over time to estimate bottomhole pressures based on wellhead pressure measurements.


This tool enables the calculation of pressure losses within the well under given operating conditions, allowing for sensitivity analysis.
Allows users to assign different correlations to wells to calculate bottomhole pressures throughout the well’s lifecycle.
Generates dynamic bottomhole pressure values based on wellhead pressure measurements, using the previously validated correlations for each well.

PVT

Different PVT tables or correlations can be associated with wells and layers to be used by other tools within Sahara.


This module allows you to obtain the necessary parameters to generate a PVT table based on correlations.
This module allows you to view PVT tables that were either generated within Sahara or imported from external data.

Unconventional

Sahara offers a comprehensive set of tools and methodologies specifically designed to analyze data from unconventional resources, both during completion and production. Production analysis can be performed at the well or well group level.


This tool supports informed decision-making to optimize the development of unconventional reservoirs by providing areal visualization and analysis tools for the study and characterization of parent-child interactions within well groups.
To enhance the analysis of parent-child interactions, we are developing a specialized 3D window for visualizing tracer experiment results. This tool will allow for FracHits detection and analysis of the flowback process.
Users can define different workflows using diagnostic and visualization plots, transient rate analysis (RTA and fractional dimension RTA), and specialized decline curve analysis.
Historical data can be compared to study and identify the behavior of well groups. Users can run Monte Carlo simulations to obtain statistical forecasts, apply statistical analysis tools, and compare different methods to generate type curves.
The modeling tool allows users to match the production history of a well and generate forecasts under different pressure or production conditions. It also supports the creation of synthetic wells under various conditions, geometries, and flow directions. Additionally, sensitivity analyses can be performed to evaluate the impact of different parameters in the available models (linear, analytical butterfly, and numerical butterfly).
This tool helps evaluate the effect of key parameters on the geometry of the Butterfly model.
To support production analysis workflows, Sahara includes additional tools for performing dynamic bottomhole pressure calculations based on surface pressure, PVT parameter visualization and calculation, and relative permeability curve generation for multiphase flow analysis. The Well Path window is also available to visualize dynamic attributes, profiles, interventions, and completions along horizontal well trajectories, together with top and base maps they intersect.

Miscellaneous

Some complementary tools expand Sahara’s capabilities and make it easier to organize, manage, and perform advanced analysis on projects. From viewing the activity history to integrating with artificial intelligence solutions, these utilities are designed to streamline daily work and maximize the value of your data at every stage of the analysis.


The history of data imports or updates made in the project can be viewed.
This window allows configuring specific working directories within Sahara to facilitate access to files and templates.
This option allows selecting a group of wells and creating a new project that includes only the selected wells. This helps reduce the project area so that it only encompasses the desired group of wells.
This feature helps organize information associated with a Sahara project. Files in multiple formats can be categorized and linked to different project objects. Users can access and view them through a built-in explorer within Sahara.
Sahara is integrated with the Aleph® software to perform calculations using artificial intelligence applied to reservoir analysis. It enables the synthesis of missing or rarely measured logs from other available data, the estimation of permeability and porosity profiles from cores, and the characterization of the reservoir in both areal and vertical directions using large-scale, multivariate data analysis techniques. Through advanced data handling methods, a Sahara project can be prepared for any Machine Learning application. Current developments for unconventional reservoirs include SRV (Stimulated Reservoir Volume) characterization based on production time series and FracHits monitoring during completion operations.